Report the carbon you can prove.
Clear data. Clean proof.
The energy and carbon figures a data centre reports, with the evidence and method behind each one.

Three questions developers and operators ask
My auditor wants the method behind our PUE. Can we show it?
My customer wants their share of the site's emissions. What do I send them?
Planning wants whole-life carbon for the next site. What do we have to show?
Standards and frameworks covered today
ISO standards
- ISO 14064-1 · Greenhouse gas inventories
- ISO 50001 · Energy management systems
EU and UK law
- EED · Energy Efficiency Directive, including the Delegated Regulation (EU) 2024/1364 reporting duty
- EU Taxonomy · Sustainable activity screening and disclosure
Industry codes and frameworks
- EU Code of Conduct for Data Centre Energy Efficiency · Participant and best-practice register
In the order you actually work.
Get the data in
Meter exports, line diagrams, refrigerant logs and BMS channel exports are uploaded or connected, rather than gathered by hand once a year.
From your data to the figure
Kai extracts and calculates from your inputs and asks your team about gaps until the dataset is complete. Each figure carries its evidence and method.
Separate your customers' share
Operator and customer energy separated using metered data and PUE, built to prevent double-counting, so each customer gets an allocation for their own reporting.
Report it
One inventory, both formats: built on ISO 14064-1, with the GHG Protocol view derived from it. The EED report is submission-ready, due 15 May each year.
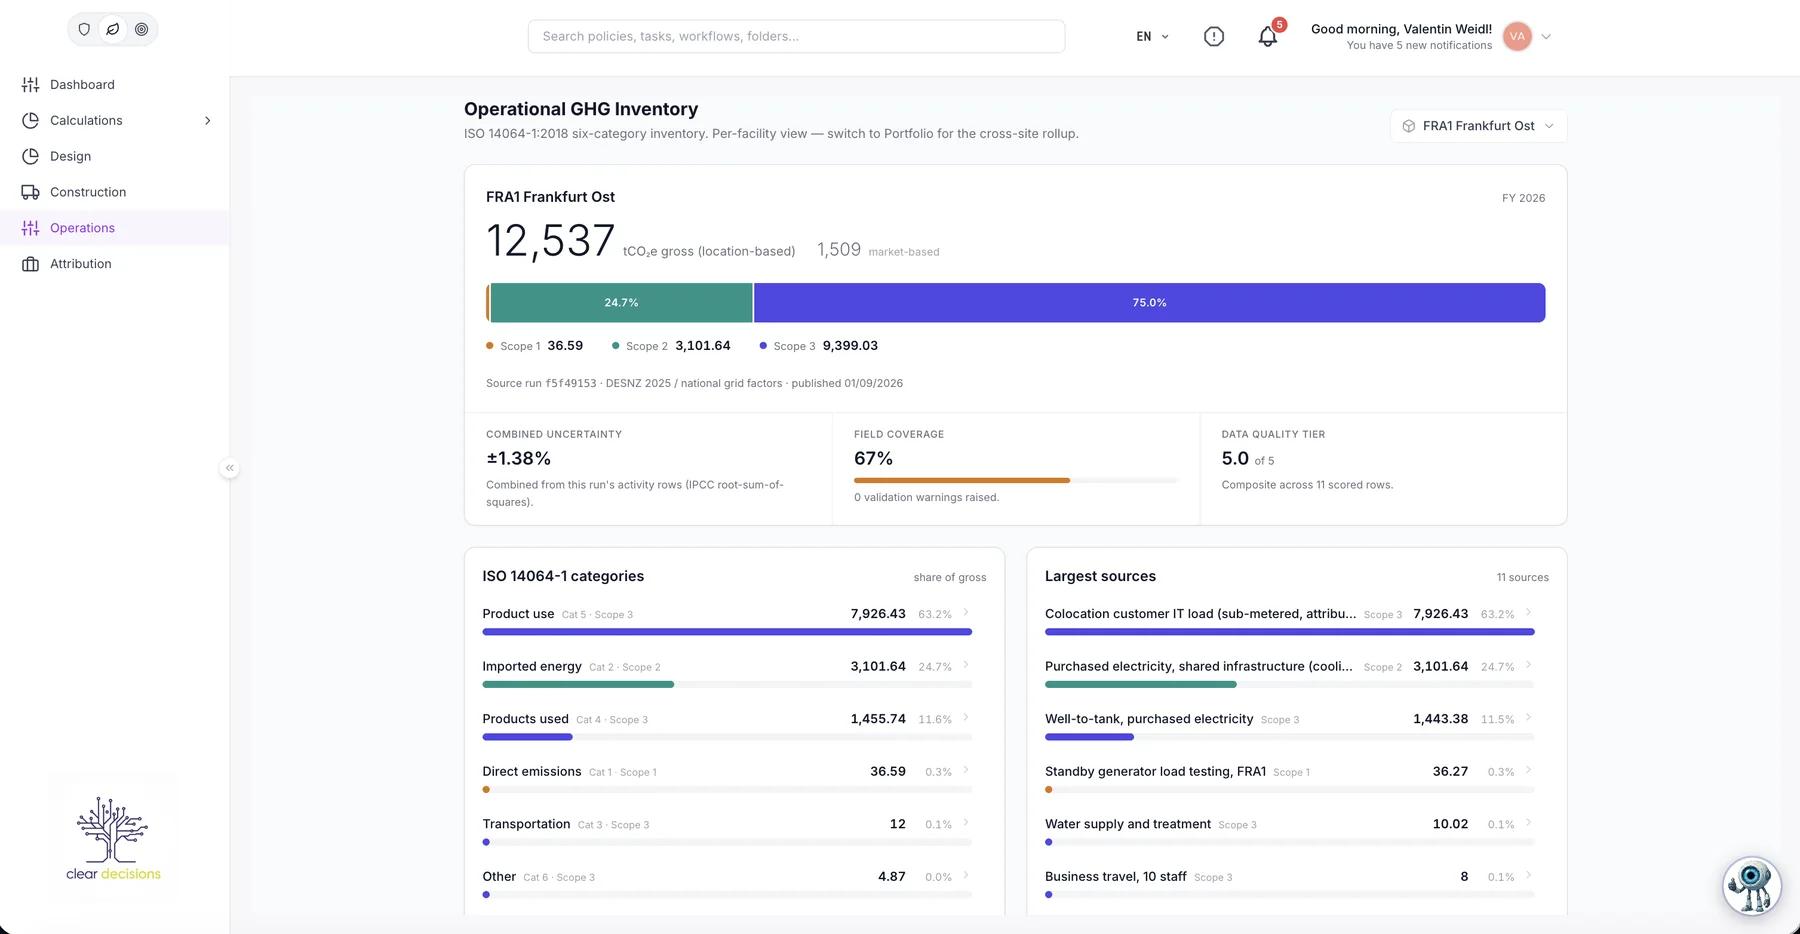
The artefact, not the dashboard.
Nobody buys a dashboard. They buy the thing that goes in front of an auditor, a customer or a board.
- Per-customer carbon statement, with the method behind it
- EED submission pack for the European database
- ISO 14064-1 inventory, with the evidence export for your auditor
- PUE, WUE, ERF and CER, each carrying the meter data, the calculation and the recorded period behind it
Carbon as a design decision, then tracked through the build.
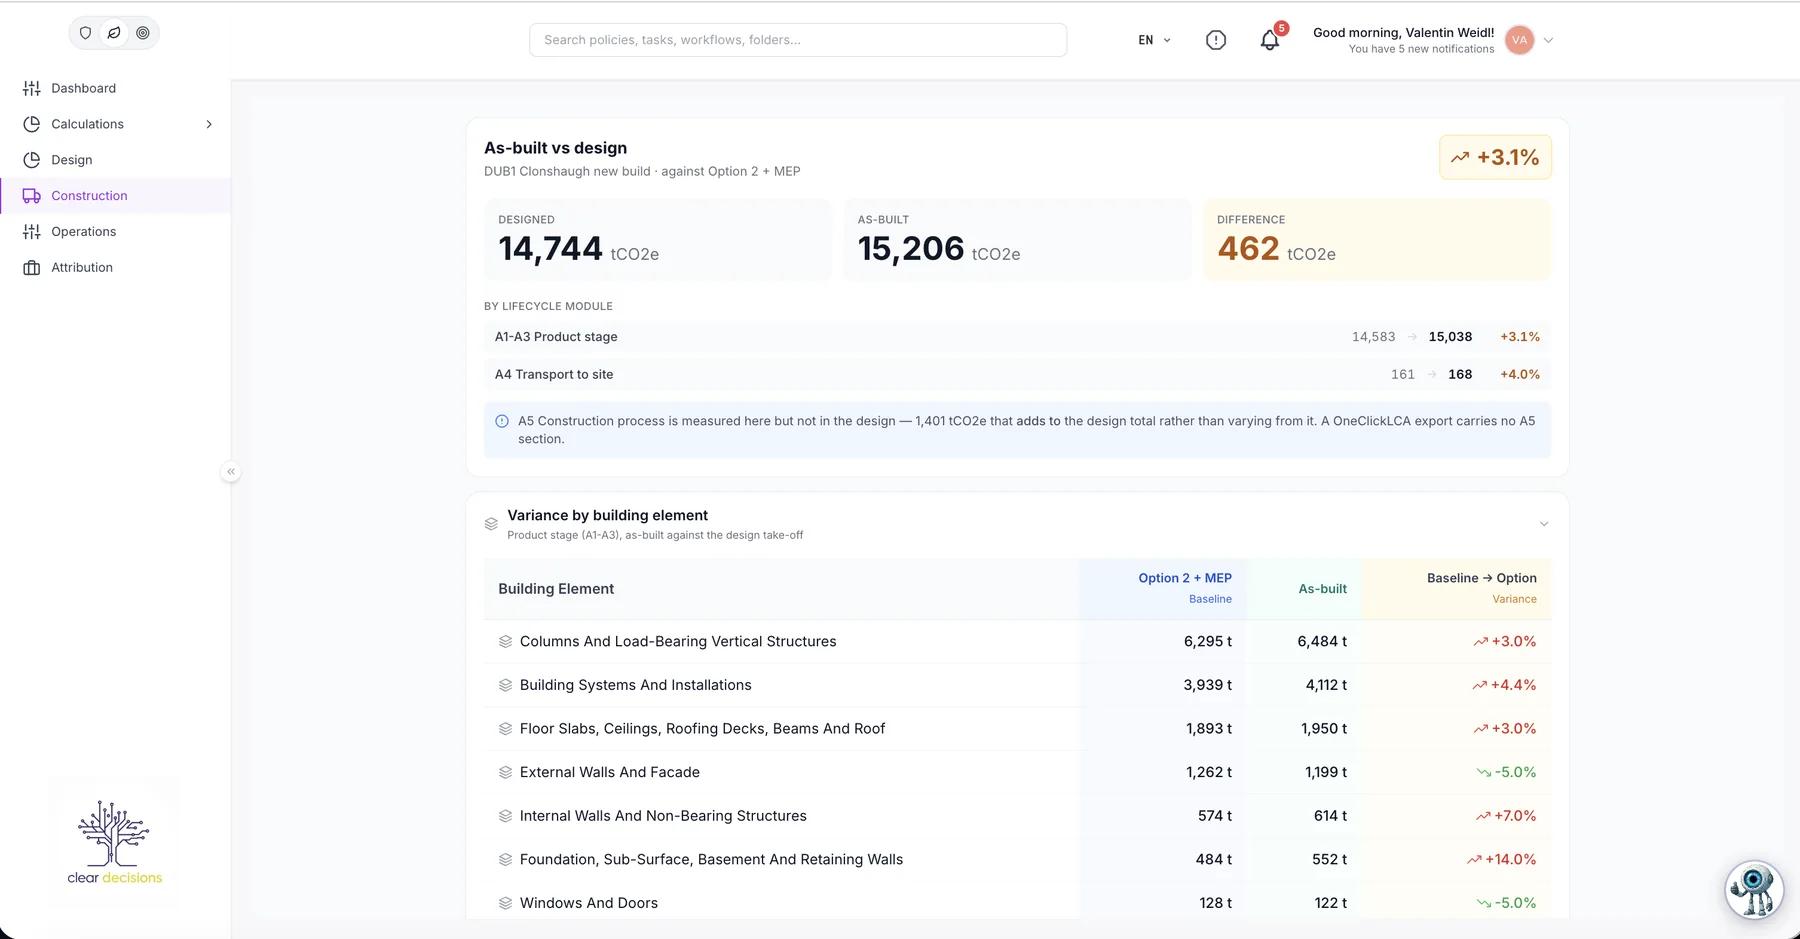
Whole-life carbon for a new build, with fabric and mechanical and electrical scenarios compared, hotspots surfaced and recommendations on materials and replacement cycles. Through construction, contractor and supplier data, any existing life-cycle assessment and the platform’s own calculation are reconciled in one report, so variance against the design estimate shows up while there is still time to act.
- In pilot on live new-build projects
Ask Kai, inside Sustainability and Carbon.

Three people, three different fears.
The sustainability owner
Owns EED reporting and the numbers being defensible in public. Newest of the roles and the one with the least tooling.
The account manager
Fields tenant requests for emissions data and has nothing repeatable to send back.
The signer
Carries the disclosure. Wants a method that holds up when a customer’s auditor asks how the number was reached.
See where you stand before you talk to us.
The colocation average sits around 1.7 and the leaders are closer to 1.4. Work out where you land, then see what that means for what you report.
Open the PUE calculator“Clear Decisions collates the data, adds the evidence, and is designed to produce the audit-ready reporting an EU Taxonomy assessment requires.”
“The ability of your model to pull out the quality of information from that data is spectacular.”

Kai interprets. People verify.
Kai explains what a regulation means and proposes the fix. Your team decides. The evidence behind every finding carries a source and a date, because a compliance record that reads as machine-generated is worth nothing in an audit.